This demo introduces a small plugin which can be used to auto-generate legend items for each separate column/series in the chart.
The post Generate legend markers for each column appeared first on amCharts.
This demo introduces a small plugin which can be used to auto-generate legend items for each separate column/series in the chart.
The post Generate legend markers for each column appeared first on amCharts.
With the release of amCharts Angular plugin 1.2 we’ve made some significant changes. If you were using this plugin before, make sure you read below and update your code accordingly, so that you can use the plugin in the most efficient way.
We have retired the <amCharts> element in favor of AmChartsService.
While we will continue supporting the old way for now, we strongly suggest updating your code to use the new syntax.
Below are examples of the old and new usage.
@Component({
  template: `<amCharts [id]="id" [options]="options" [style.width.%]="100" [style.height.px]="500"></amCharts>`
})
export class AppComponent {
  private id = "chartdiv";

  private options = {
    "type": "serial",
    "theme": "light",
    "dataProvider": []
    ...
  };
}
import { AmChartsService } from "amcharts3-angular2";

@Component({
  template: `<div id="chartdiv" [style.width.%]="100" [style.height.px]="500"></div>`
})
export class AppComponent {
  constructor(private AmCharts: AmChartsService) {}

  private chart = this.AmCharts.makeChart("chartdiv", {
    "type": "serial",
    "theme": "light",
    "dataProvider": []
    ...
  });

  ngOnDestroy() {
    this.AmCharts.destroyChart(this.chart);
  }
}
changeChart() {
  // Make a copy of the existing config
  this.options = JSON.parse(JSON.serialize(this.options));

  // Change the config
  this.options.dataProvider = [...];
}
Or
makeConfig(dataProvider) {
  return {
    "type": "serial",
    "theme": "light",
    "dataProvider": dataProvider
    ...
  };
}

changeChart() {
  this.options = this.makeConfig([...]);
}
changeChart() {
  this.AmCharts.updateChart(this.chart, () => {
    this.chart.dataProvider = [...];
  });
}
The post Migrating to amCharts Angular plugin 1.2 appeared first on amCharts.
This demo shows how you can use AmCharts.addInitHandler() to manipulate the order of the chart’s data items before the chart renders.
The post Automatically order columns by their value appeared first on amCharts.
This demo shows how you can use external controls and Radar chart’s API to implement an interactive “Wheel of Life” chart.
Each click on each question updates corresponding guide on the chart.
The post Interactive “Wheel of Life” chart appeared first on amCharts.
This demo shows how we can simulate multi-segment columns using GANTT chart. This specific chart type is good because you can specify any number colored segments without the need to define graphs for each of them.
Since GANTT chart is always horizontal by default, we also use the following trick to rotate it before it renders:
AmCharts.addInitHandler(function(chart) {
  chart.rotate = false;
}, ["gantt"]);
The post Using GANTT chart to display multi-segmented columns/bars appeared first on amCharts.
A map or a chart will always try to take up all of the area of its container. Which means that your container needs to be sized in order for the chart/map to even become visible.
Block level elements, such as <div> automatically take up the whole available width.
Unfortunately, that’s not the case with the height. A div will try to dynamically change its height to accommodate its content. Since chart/map container is initially empty, it will have zero height. This in turn means that chart/map will check available space when initializing, which will come out as zero – no map or chart. Or more like zero-height chart. Not good.
For this we usually go and set explicit height of the container. I.e.:
#chartdiv {
  width: 100%;
  height: 400px;
}
This works, but it will also mean that it will have a constant height, regardless of the available width. The aspect ration will not be kept.
We might utilize CSS media queries to target and override height for specific resolutions, but its an extra work and maintenance.
This demo shows a trick which lets you always keep the height relative to its width using only CSS.
For this we will need to wrap our `chartdiv` into another element, which we will use for sizing:
<div class="chartwrapper">
  <div id="chartdiv" class="chartdiv"></div>
</div>
And we will apply the following CSS:
.chartwrapper {
  width: 70%;
  position: relative;
  padding-bottom: 50%;
  box-sizing: border-box;
}

.chartdiv {
  position: absolute;
  width: 100%;
  height: 100%;
}
Now, our container will always keep the height relative to the width at 2:1 ratio. The padding-bottom CSS setting defines the ratio.
P.S. you might want to open CodePen demo in a separate window, so you can resize it and check how height changes based on available width.
The post Using CSS to dynamically size map or chart height based on available width appeared first on amCharts.
NOTE: this demo refers to Google Finance API service, which has been discontinued by Google. It may become unavailable at any point in the future. You are advised to take that into account before making decisions on your data sourcing. If you are looking for a reliable data source, amCharts recommends CloudQuote. [More info]
If you want to use data loaded from Google Finance API CSV, we will have to go through some steps before you can use those on a Stock Chart.
While we can use our own Data Loader plugin to do most of the work for us, there are some nuances. Let me walk you through them.
Dates in Google’s CSV are formatted like this: “4-May-17”.
The chart can’t parse or understand one-digit days, two-digit years or name-based months.
We’ll use Data Loader’s postProcess callback function to reformat those dates into chart-suitable format before it’s used:
"postProcess": function( data ) {

        // Function that reformats dates
        function reformatDate( input ) {

          // Reformat months
          var mapObj = {
            "Jan": "01",
            "Feb": "02",
            "Mar": "03",
            "Apr": "04",
            "May": "05",
            "Jun": "06",
            "Jul": "07",
            "Aug": "08",
            "Sep": "09",
            "Oct": "10",
            "Nov": "11",
            "Dec": "12"
          };

          var re = new RegExp( Object.keys( mapObj ).join( "|" ), "gi" );
          input = input.replace( re, function( matched ) {
            return mapObj[ matched ];
          } );

          // Reformat years and days into four and two digits respectively
          var p = input.split("-");
          if (p[0].length == 1) {
            p[0] = "0" + p[0];
          }
          if (Number(p[2]) > 50) {
            p[2] = "19" + p[2];
          }
          else {
            p[2] = "20" + p[2];
          }
          return p.join("-");
        }

        // Reformat all dates
        for ( var i = 0; i < data.length; i++ ) {
          data[ i ].Date = reformatDate( data[ i ].Date );
        }

        console.log(data);

        return data;
}
This will ensure that “4-May-17” becomes “04-05-2017”.
Now that we have that squared, we can use chart’s native dataDateFormat setting to specify the input date format:
"dataDateFormat": "DD-MM-YYYY"
The data points in Google’s CSV come in reversed order – the latest timestamp comes first.
We will need to set Data Loader’s setting reverse to true to accommodate for that.
Here’s the final set of settings, optimized for Google Finance API CSV:
"dataLoader": {

      /**
       * Originally we assume URL:
       * https://finance.google.co.uk/finance/historical?q=MSFT&startdate=Oct+1,2008&enddate=Oct+9,2008&output=csv
       * However, due to CORS restrictions, we are using the copy of the out
       */
      "url": "google_msft.csv",
      "format": "csv",
      "delimiter": ",",
      "useColumnNames": true,
      "skip": 1,

      /**
       * Google Finance API returns dates formatted like this "24-Apr-17".
       * The chart can't parse month names as well as two-digit years, so we
       * need to use `postProcess` callback to reformat those dates into a
       * chart-readable format
       */
      "postProcess": function( data ) {

        // Function that reformats dates
        function reformatDate( input ) {

          // Reformat months
          var mapObj = {
            "Jan": "01",
            "Feb": "02",
            "Mar": "03",
            "Apr": "04",
            "May": "05",
            "Jun": "06",
            "Jul": "07",
            "Aug": "08",
            "Sep": "09",
            "Oct": "10",
            "Nov": "11",
            "Dec": "12"
          };

          var re = new RegExp( Object.keys( mapObj ).join( "|" ), "gi" );
          input = input.replace( re, function( matched ) {
            return mapObj[ matched ];
          } );

          // Reformat years into four digits
          input.replace( /\-([0-9])^/, function( matched ) {
            console.log(matched);
            return matched;
          } );

          return input;
        }

        // Reformat all dates
        for ( var i = 0; i < data.length; i++ ) {
          data[ i ].Date = reformatDate( data[ i ].Date );
        }

        console.log(data);

        return data;
      }
}
The post Stock Chart with Google Finance CSV API appeared first on amCharts.
This tutorial is aimed to walk you through some easy steps to add charts and maps to your WIX.com website.
We assume that you already have fundamentals for amCharts products and are able to build a chart or map, either by coding it directly or using one of our online editing tools.
If you don’t, you might want to start with these few introductory tutorials:
If you are really really allergic to coding, you might take a look at one of our visual editing tools:
Both of the above tools will generate a ready HTML/JavaScript code which you can simply grab and drop into your WIX website, as we will explain momentarily.
I’m going to start with a blank, single-page WIX website template.
As you may be already aware, a chart or map is just a bunch of HTML and JavaScript mixed together.
I’m going to start off with this, super-easy column chart:
See the Pen WIX chart by amCharts (@amcharts) on CodePen.24419
Click on the “HTML” tab to see the underlying code.
If you examine the code, you will see three required parts that comprise a chart:
<script ....><div id="chartdiv" style="width: 100%; height: 100%;"></div><script>var chart = AmCharts.makeChart(....Each of these are required. You might stumble upon various demos and examples in a number of places where those in different places. All of them need to be combined into a single block when adding to a WIX website.
A little note about the second part. Notice the style definition? The “width: 100%; height: 100%;” might not work well in other environments, but for a WIX website it makes total sense, because every page element is a sized box. Having it at 100% width and height will ensure that the chart or map will size to fit the box automatically, even as you resize it.
WIX has a perfect page element for our chart – an “HTML Code” box. You will find it under Add > More in page editor.
We’re going to add such box and size it to fit our layout.
Now, the only think left for us to do is to add our code, which we’ll do by clicking, yes you guessed it, “Enter Code” button.
I copy and paste our chart code, and… voila! A living and breathing live chart, right there in the WIX editor.
Now, if you save and publish your website, you will have your chart up.
Same thing really. Same three code elements. Same routine.
Let’s try with this simple map:
See the Pen WIX demo map by amCharts (@amcharts) on CodePen.24419
Now, let’s walk through the same steps:
Now you have a web page with both a chart and a map.
If I open the live website, I get my chart and map as well.
And, just in case you don’t take my word for it, here’s a link to the live WIX site I used to create this tutorial:
Go create.
Use our editors to edit charts or maps.
Or, grab one of our demos as a starting point.
Visit our Knowledge Base section, which among many tutorials has countless examples with working code.
Finally, contact amCharts support, if stuck.
The post Adding charts and maps to a WIX website appeared first on amCharts.
This demo shows how you can programatically toggle Export plugin’s Annotation mode.
The following code is used to go in and out of annotation mode:
function toggleAnnotations() {
  if (chart["export"].drawing.enabled) {
    chart["export"].drawing.handler.done();
  }
  else {
    chart["export"].capture({
      "action": "draw"
    }, function() {
      var drawingMenu = chart["export"].config.menu[0].menu[2].menu;
      chart["export"].createMenu(drawingMenu);
    });
  }
}
The post Toggling export annotation mode appeared first on amCharts.
Exporting a chart or map to an image always produces a snapshot of a current view. This means if you zoom in your map and then export it to a PNG, you will get an image of its zoomed in state.
This demo shows how you can use Export plugin’s beforeCapture and afterCapture handlers to temporarily zoom out the map before export, so it produces full map image, regardless of its current zoom state.
We are also using map’s init event to log its zoom settings when it first loads.
"listeners": [{
  "event": "init",
  "method": function(e) {

    var map = e.chart;

    /**
     * Log initial zoom settings
     */
    map.initialZoom = {
      "zoomLevel": e.chart.zoomLevel(),
      "zoomLongitude": e.chart.zoomLongitude(),
      "zoomLatitude": e.chart.zoomLatitude()
    };
  }
}]
Then we can use Export’s own events to quickly restore those initial zoom settings using maps zoomToLongLat() method, just before export. Then restore back to current zoom.
"export": {
  "enabled": true,
  "position": "bottom-right",
  "beforeCapture": function() {
    var map = this.setup.chart;
    /**
     * Log current zoom settings so we can restore after export
     */
    map.currentZoom = {
      "zoomLevel": map.zoomLevel(),
      "zoomLongitude": map.zoomLongitude(),
      "zoomLatitude": map.zoomLatitude()
    };

    /**
     * Zoom to initial position
     */
    map.zoomToLongLat(
      map.initialZoom.zoomLevel,
      map.initialZoom.zoomLongitude,
      map.initialZoom.zoomLatitude,
      true
    );
  },
  "afterCapture": function() {
    var map = this.setup.chart;
    setTimeout(function() {
      /**
       * Restore current zoom
       */
      map.zoomToLongLat(
        map.currentZoom.zoomLevel,
        map.currentZoom.zoomLongitude,
        map.currentZoom.zoomLatitude,
        true
      );
    }, 10);
  }
}
The post Always exporting fully zoomed out map appeared first on amCharts.
This demo shows how you can overlay JavaScript Maps over Google Maps as well as sync up zoom and pan position for both.
The post JavaScript Maps overlaid over Google Maps appeared first on amCharts.
It is possible to use Data Loader with Live Editor. I say “technically” because there are some caveats, which I will outline a bit later.
First, to enable Data Loader, click on the Extra Config checkbox to enable plugin settings.
Then, type in Data Loader config into appropriate box. I.e.:
{
  "enabled":true,
  "url":"https://www.mysite.com/data.php",
  "format":"json"
}
That’s it. When Editor detects Data Loader active, it will hide the Data tab and will attempt loading your external data.
Now onto caveats I mentioned.
1) The Editor is under SSL (https://) which means that the URL for your data source should be as well. The browser will prevent loading of non-SSL resources on an SSL-enabled page.
2) You will need to ensure that your web server, which serves the data has appropriate cross-origin HTTP request (CORS) settings, to allow load requests from Live Editor.
Here’s more information about CORS.
And, just in case you were wondering, here’s a real Live Editor chart using Data Loader and external data.
The post Loading external data in Live Editor appeared first on amCharts.
This demo shows how you can use Data Loader plugin’s function AmCharts.loadFile() as well as AmCharts.parseCSV() to load and parse CSV data, then dynamically build an HTML table out of it.
The post Using Data Loader to load external data and display it in the table appeared first on amCharts.
By default Export plugin would name a work sheet of an exported XLSX file “amCharts”.
We can use menuReviver to override that setting with anything else:
"export": {
  "enabled": true,
  "menuReviver": function(item,li) {
    if (item.format == "XLSX") {
      item.name = "My sheet";
    }
    return li;
  }
}
This will affect XLSX export only.
The post Changing XLSX sheet name when exporting appeared first on amCharts.
When you click an object on the map – an area or image – that has a description, the object is selected and the description box pops up.
This demo shows how you can use descriptionClosed event and selectObject() method without any parameters to automatically unselect the object when the description box is closed.
"listeners": [{
  "event": "descriptionClosed",
  "method": function(ev) {
    ev.chart.selectObject();
  }
}]
The post Unselecting map object after its description box is closed appeared first on amCharts.
Vue.js is a popular JavaScript framework, and we get regular questions from people wanting to use amCharts in their Vue apps. In this quick guide, we will cover the basics of using amCharts in a most straightforward Vue.js app and then continue with a more advanced setup utilizing Vue components and Webpack.
Let’s start with a very basic Vue.js page that renders an amCharts Pie chart on it.
Create a basic HTML boilerplate page. Something like this:
<!DOCTYPE html>
<html lang="en">
<head>
    <meta charset="UTF-8">
    <meta name="viewport" content="width=device-width, initial-scale=1.0">
    <meta http-equiv="X-UA-Compatible" content="ie=edge">
    <title>Document</title>
</head>
<body>

</body>
</html>
Now, let’s add references to the Vue and amCharts libraries:
<script src="https://unpkg.com/vue"></script>
<script src="//www.amcharts.com/lib/3/amcharts.js"></script>
<script src="//www.amcharts.com/lib/3/pie.js"></script>
In the body we will add a div to hold our Vue content and our pie chart:
<div id="app">
    {{ message }}

    <div id="chartdiv" style="width: 100%; height: 400px;"></div>
</div>
Then we should instantiate our Vue app:
<script>
    var app = new Vue({
        el: '#app',
        data: {
            message: 'Hello, Vue + amCharts!'
        }
    })
</script>
And then create our pie chart:
AmCharts.makeChart("chartdiv",
    {
        "type": "pie",
        "titleField": "title",
        "valueField": "value",
        "dataProvider": [
            { "title": "Big slice", "value": 555 },
            { "title": "Small slice", "value": 25 }
        ]
    }
);
And that’s all there is to it.
Except no one probably makes their apps this way. So, let’s continue to a more realistic setup.
In this example, we will a add a column chart to a Vue.js app based on webpack-simple template.
You will need Node.js and npm to follow along. Installing these is beyond the scope of this tutorial, so I’ll assume you already have them set up.
You will need to install vue-cli to scaffold our demo project:
$ npm install -g vue-cli
Now we will create our initial project we will work in by running the following commands in our working directory:
$ vue init webpack-simple vue-amcharts
$ cd vue-amcharts
$ npm install
After this, you should have a functional Vue.js app. Test it by running the following command in the vue-amcharts directory:
$ npm run dev
Let’s continue by adding amCharts. Install amCharts JavaScript Charts from npm:
$ npm install amcharts/amcharts3 --save
Import the main amCharts and Serial chart libraries in src/main.js:
import AmCharts from 'amcharts3'
import AmSerial from 'amcharts3/amcharts/serial'
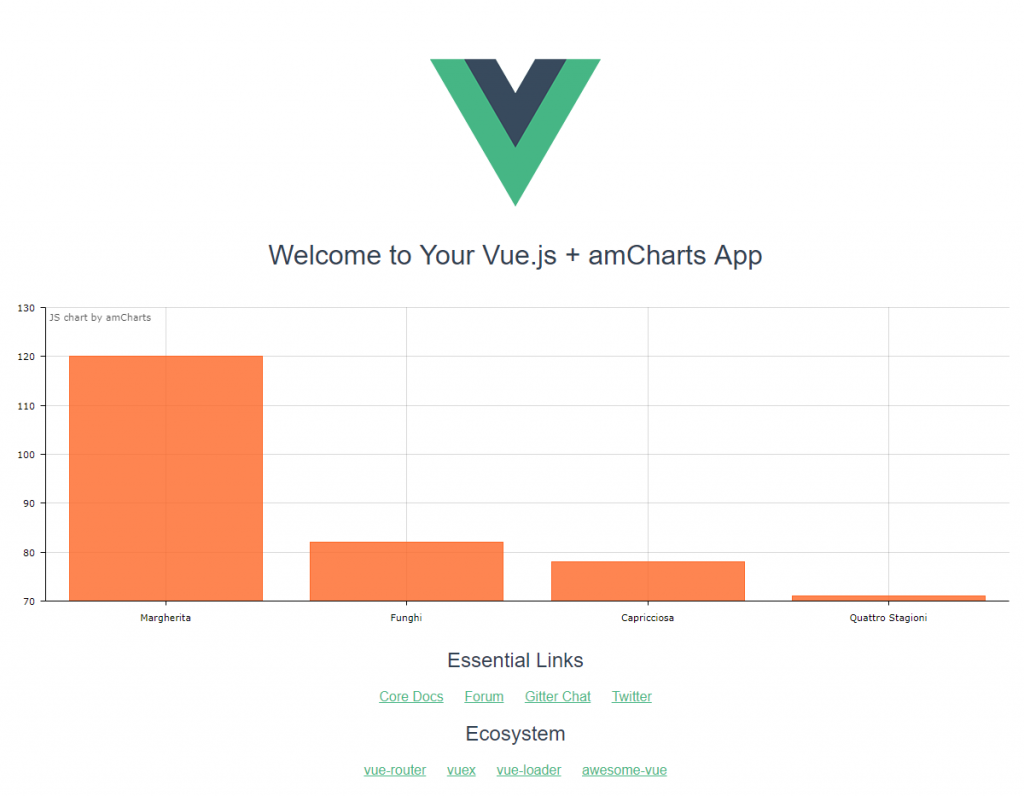
Open App.vue file in the src folder. This is the main component of our app. For the purpose of this tutorial let’s leave the content that is in there intact and just insert a div to hold our chart under the Vue logo. So that the top part of <template> looks something like this:
<template>
  <div id="app">
    <img src="./assets/logo.png">
    <h1>{{ msg }}</h1>

    <div id="chartdiv" style="width: 100%; height: 400px;"></div>

    <h2>Essential Links</h2>
Now let’s add our chart rendering code. In the script section of the component add a created method that will be fired after the Vue component is created and put your amCharts code in it. After you are done your script part of the component should look something like this:
<script>
export default {
  name: 'app',
  data() {
    return {
      msg: 'Welcome to Your Vue.js + amCharts App'
    }
  },
  created () {
    AmCharts.makeChart("chartdiv",
      {
        "type": "serial",
        "categoryField": "type",
        "chartCursor": {},
        "graphs": [
          {
            "type": "column",
            "title": "Pizza types",
            "valueField": "sold",
            "fillAlphas": 0.8
          }
        ],

        "dataProvider": [
          { "type": "Margherita", "sold": 120 },
          { "type": "Funghi", "sold": 82 },
          { "type": "Capricciosa", "sold": 78 },
          { "type": "Quattro Stagioni", "sold": 71 }
        ]
      }
    );
  }
}
</script>
Run npm run dev and what you see should look like this:
That would be all for the simplest case. However, there’s a little bit more to it.
If you zoom into this chart by selecting a portion of it with your mouse, you would see something missing:

That’s because the chart is looking for image assets for some of its elements (“lens” button image in this case) and not finding them. To resolve this, we need to update our Webpack configuration to bring these needed assets over. We will instruct Webpack to simply copy the assets to our output directory (“dist” by default).
To do that we will utilize Copy Webpack Plugin. Install it by issuing this command:
$ npm install --save-dev copy-webpack-plugin
Open webpack.config.js file and add a statement to include the plugin at the top:
var CopyWebpackPlugin = require('copy-webpack-plugin');
Then add plugins section to the Webpack configuration:
plugins: [
  new CopyWebpackPlugin([{ from: 'node_modules/amcharts3/amcharts/images', to: 'amcharts/images' },])
],
This will copy the images over. You may want to copy other assets as well if you plan to use amCharts plugins, but just images should be enough in the scope of this tutorial.
The final step left is to inform amCharts of the root directory for amCharts assets. Go back to the App.vue component file and add “path” setting to the call to makeChart:
AmCharts.makeChart("chartdiv",
  {
    "path": "dist/amcharts/",
    "type": "serial",
    "categoryField": "type",
Run the build process once to copy the files over:
$ npm run build
And now you should be ready to go.
Start your dev environment again with npm run dev and everything should be in place now:

You can download all the code for the above samples here.
The post Using amCharts with Vue.js and Webpack appeared first on amCharts.
The post Using Animate plugin with play/pause button appeared first on amCharts.
This demo shows how we can create a chart with just a date-based value axis (type: "date") and Guides to create a timeline with certain events (milestones) marked, but without any actual chart.
The post A time-line chart with date-based milestones appeared first on amCharts.
This demo shows how you can combine generic mouse click event (using jQuery) and chart cursor’s changed event to simulate clicking on the whole category on column chart, not just actual column.
Chart cursor has changed event set up. It is triggered every time you move the cursor over a new category, or move the cursor out of the plot area. The handler function registers the index of the cursor’s position for later use.
The jQuery’s generic click event is set on the whole of the chart. When its triggered, the handler function checks for the last cursor position, which is enough to find out which data point the cursor was on when the click occurred.
The post Registering click on the whole of the category on column chart appeared first on amCharts.
This demo shows how you can attach click events to GaugeAxis bands using listeners array:
"listeners": [{
  "event": "clickBand",
  "method": function(ev) {
    console.log("Clicked on " + ev.dataItem.balloonText)
  }
}]
The post Invoking custom handlers on gauge band click appeared first on amCharts.


